Water Consumption Dashboard
Welcome to the WaterConsumption Dashboard.
This dashboard translates complex geodata on precipitation, water consumption and biomass into easy-to-understand information for time series analysis at basin and administrative level.
The dashboard is made for the Dutch embassies in Egypt, Jordan, Kenya and South Africa that work with their partners and clients on sustainable agriculture, nature based solutions and climate resilience.
The dashboard can help embassy staff, but also consultants and experts in scoping, investment and inception studies. Projects related to sustainable land and water use and climate change can use this dashboard for monitoring and evaluation.
The dashboard is part of the G4AW Geodata Demonstrators 2023-2024.
Click here below to go the dashboards. A manual is there to guide you in the dashboard functionality. And there is documentation on how the data is made and presented.
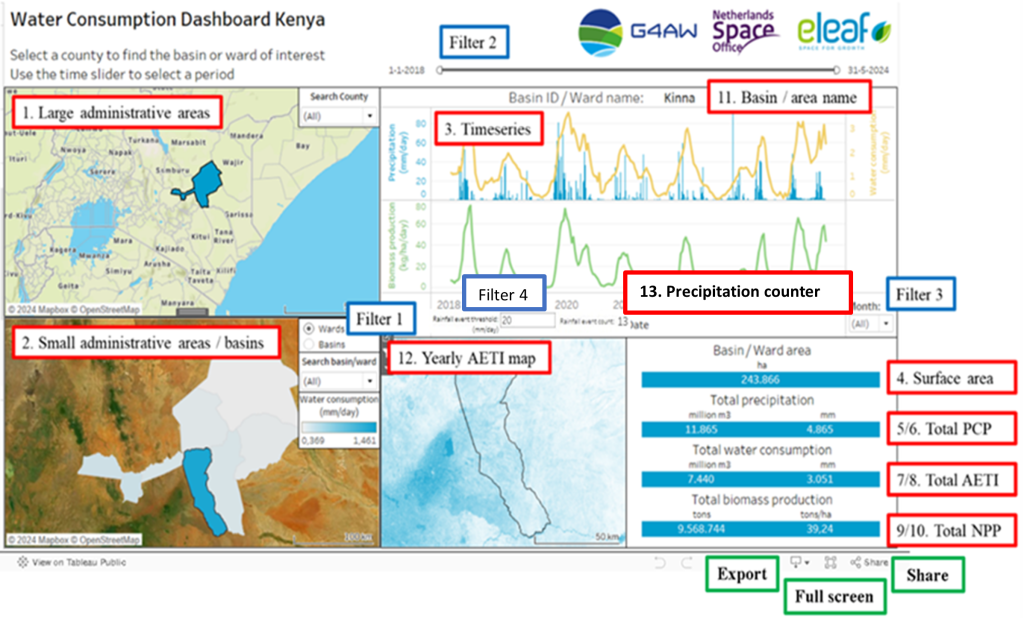
The basic functionality of the Water Consumption Dashboard can be summarized as follows:
1. Select a large administrative area (e.g. County in Kenya): this filters the small administrative areas (e.g. Wards in Kenya) and the overlapping basins.
2. Select a small administrative area or a basin: This filters the WaPOR data and shows a timeseries and the cumulative amounts of the precipitation, actual evapotranspiration and interception and net primary production as well as the total area of the selected basin / area.
3. Use the time slider to select the period of interest.
The following figure explains every part of the dashboard:
1. Displays the large administrative areas. When clicked, the areas in worksheet 2 are filtered.
2. Displays the small administrative areas or basins. When clicked, the WaPOR data is filtered and it shows up as a timeseries in worksheet 3. Cumulative values, the surface area and the name/Basin ID are displayed in worksheets 4 – 11. Lastly, the yearly AETI map zooms to the chose area to show greater detail.
3. Displays the timeseries of the chosen area.
4. Displays the surface area of the chosen area.
5. Displays the total precipitation over the chosen period of interest in million m3 (using the surface area).
6. Displays the total precipitation over the chosen period of interest in mm.
7. Displays the total evapotranspiration over the chosen period of interest in million m3 (using the surface area).
8. Displays the total evapotranspiration over the chosen period of interest in mm.
9. Displays the total net primary production over the chosen period of interest in tons (using the surface area).
10. Displays the total net primary production over the chosen period of interest in tons/ha.
11. Displays the basin / area name.
12. Displays a level 2 yearly AETI map to assess smaller scale spatial variations
13. Displays the number of days with rainfall equal to or above the specified threshold
Filter 1: Select administrative or hydrological object
Filter 2: Select months of the year to display
Filter 3: Select period of time in the time slider, ranging from 2018 to may 2024
Filter 4: Set rainfall threshold to display days with precipitation equal to or above the specified value.
Export: the current dashboard setting can be exported as image, PDF or PowerPoint
Full Screen: sets the dashboard to full screen of the web browser
Share: the current setting is shared as an URL link or code to embed in a webpage
The Water Consumption Dashboard is based on the following data sets:
Precipitation, evapotranspiration and biomass from WaPOR
Data on precipitation, evapotranspiration (used as a proxy for water consumption) and biomass was sourced from WaPOR version 3 (https://www.fao.org/in-action/remote-sensing-for-water-productivity/wapor-data/en)
The following products were used:
- L1-PCP-E (daily precipitation (mm) at 5 km resolution)
- L2-AETI-D (dekadal actual evapotranspiration and interception (mm) at 100 m resolution)
- L2-AETI-A (annual actual evapotranspiration and interception (mm) at 100 m resolution)
- L2-NPP-D (dekadal net primary production (gC/m2/day) at 100 m resolution)
- The L1-PCP-E, L2-AETI-D and L2-NPP-D (ranging from 2018 to 2024) were used to display the timeseries and to calculate the total values.
- The L2-AETI-A from 2023 was used to display as a map.
Administrative boundaries
The administrative boundaries were sourced from GADM (gadm.org),where an extensive database of up-to-date administrative boundaries can be found. Larger administrative areas were used as a searching method and for smaller administrative the precipitation, evapotranspiration and biomass values were calculated. The GADM levels that were used differ per country.
Basin boundaries
The basin boundaries were sourced from the HydroBASINS dataset from HydroSHEDS (hydrosheds.org/products/hydrobasins). This dataset provides global basin boundaries and information at different levels. For South Africa level 8 was used and level 6 for the Kenya, Jordan and Egypt.
Calculations
The following calculations are done in the dashboard:
- Basin Area (ha): translates the area from square meters to hectares (/10.000)
- Precipitation: extracts the precipitation values from the dataset.
- Evapotranspiration: extracts the evapotranspiration values from the dataset.
- Biomass: extracts the the NPP values from the dataset and translate from g/m2/day to biomass production in kg/ha/day (*22.222, based on an internal methodology document).
- Total precipitation: multiplies the precipitation with the basin area and translates it to million m3.
- Total water consumption: multiplies the evapotranspiration with the basin area, translates it to million m3 and multiplies the value by 10 to go from dekadal to daily data.

