Monitor and manage water use in agriculture effectively
Water Consumption Dashboard
Our clients, who have limited and spotty data on agricultural water use, can use our online dashboard with credible and up-to-date information on water use and related indicators. They can better monitor and manage water withdrawals and respond to requests from farmers and local governments.
Our dashboard is a unique proposition because complex geo data are translated in an affordable, time-saving and user-friendly way. The tangible information can be directly used for reporting, decision-making and planning.
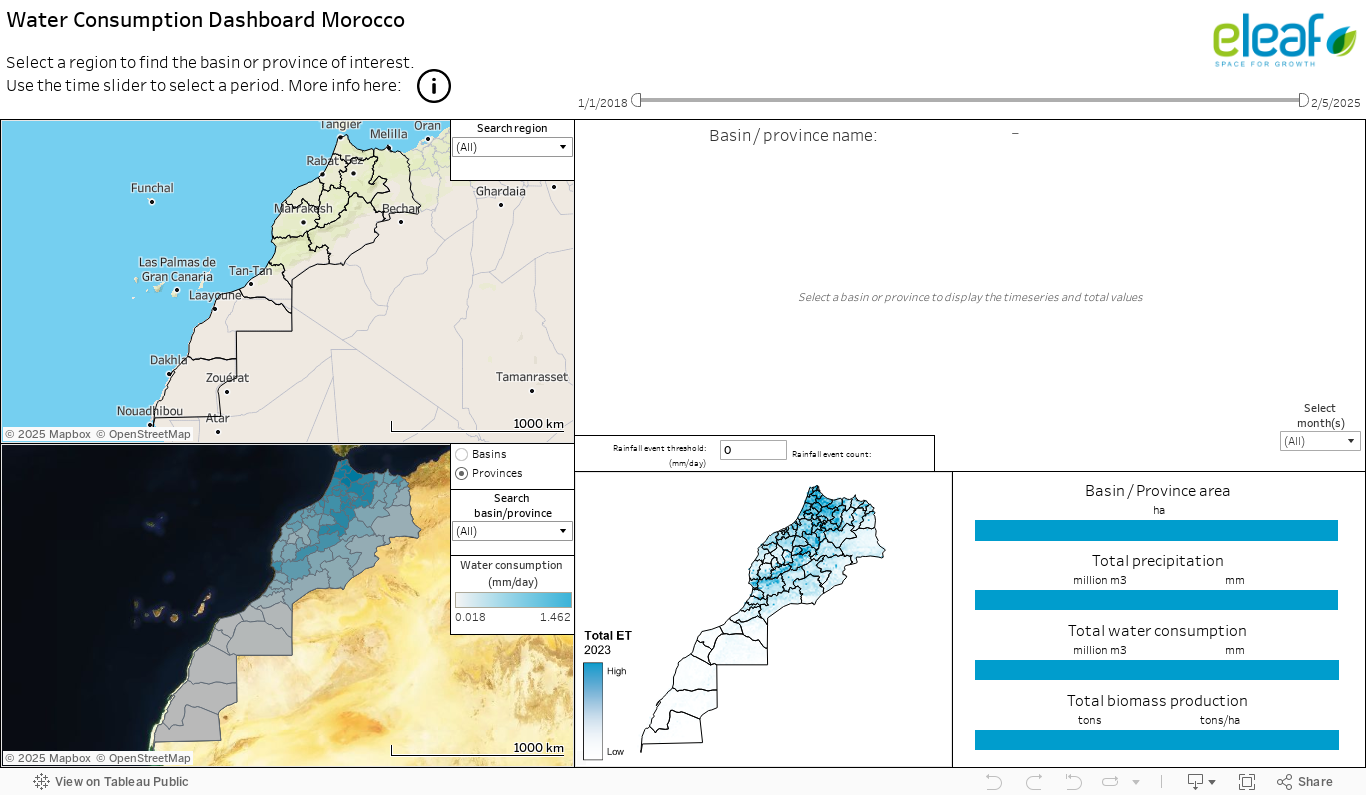
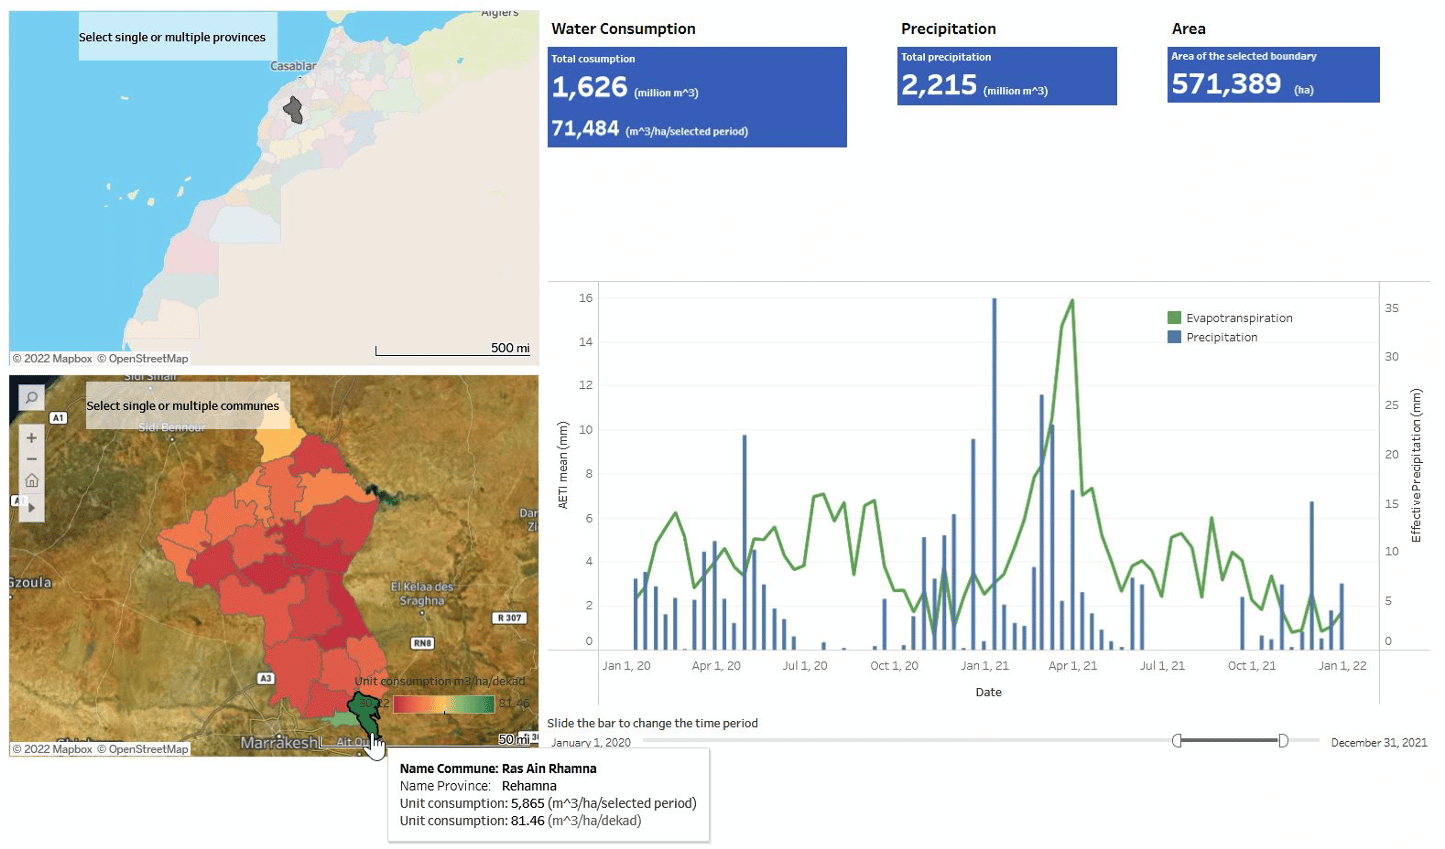
See a demo version here below from Morocco.
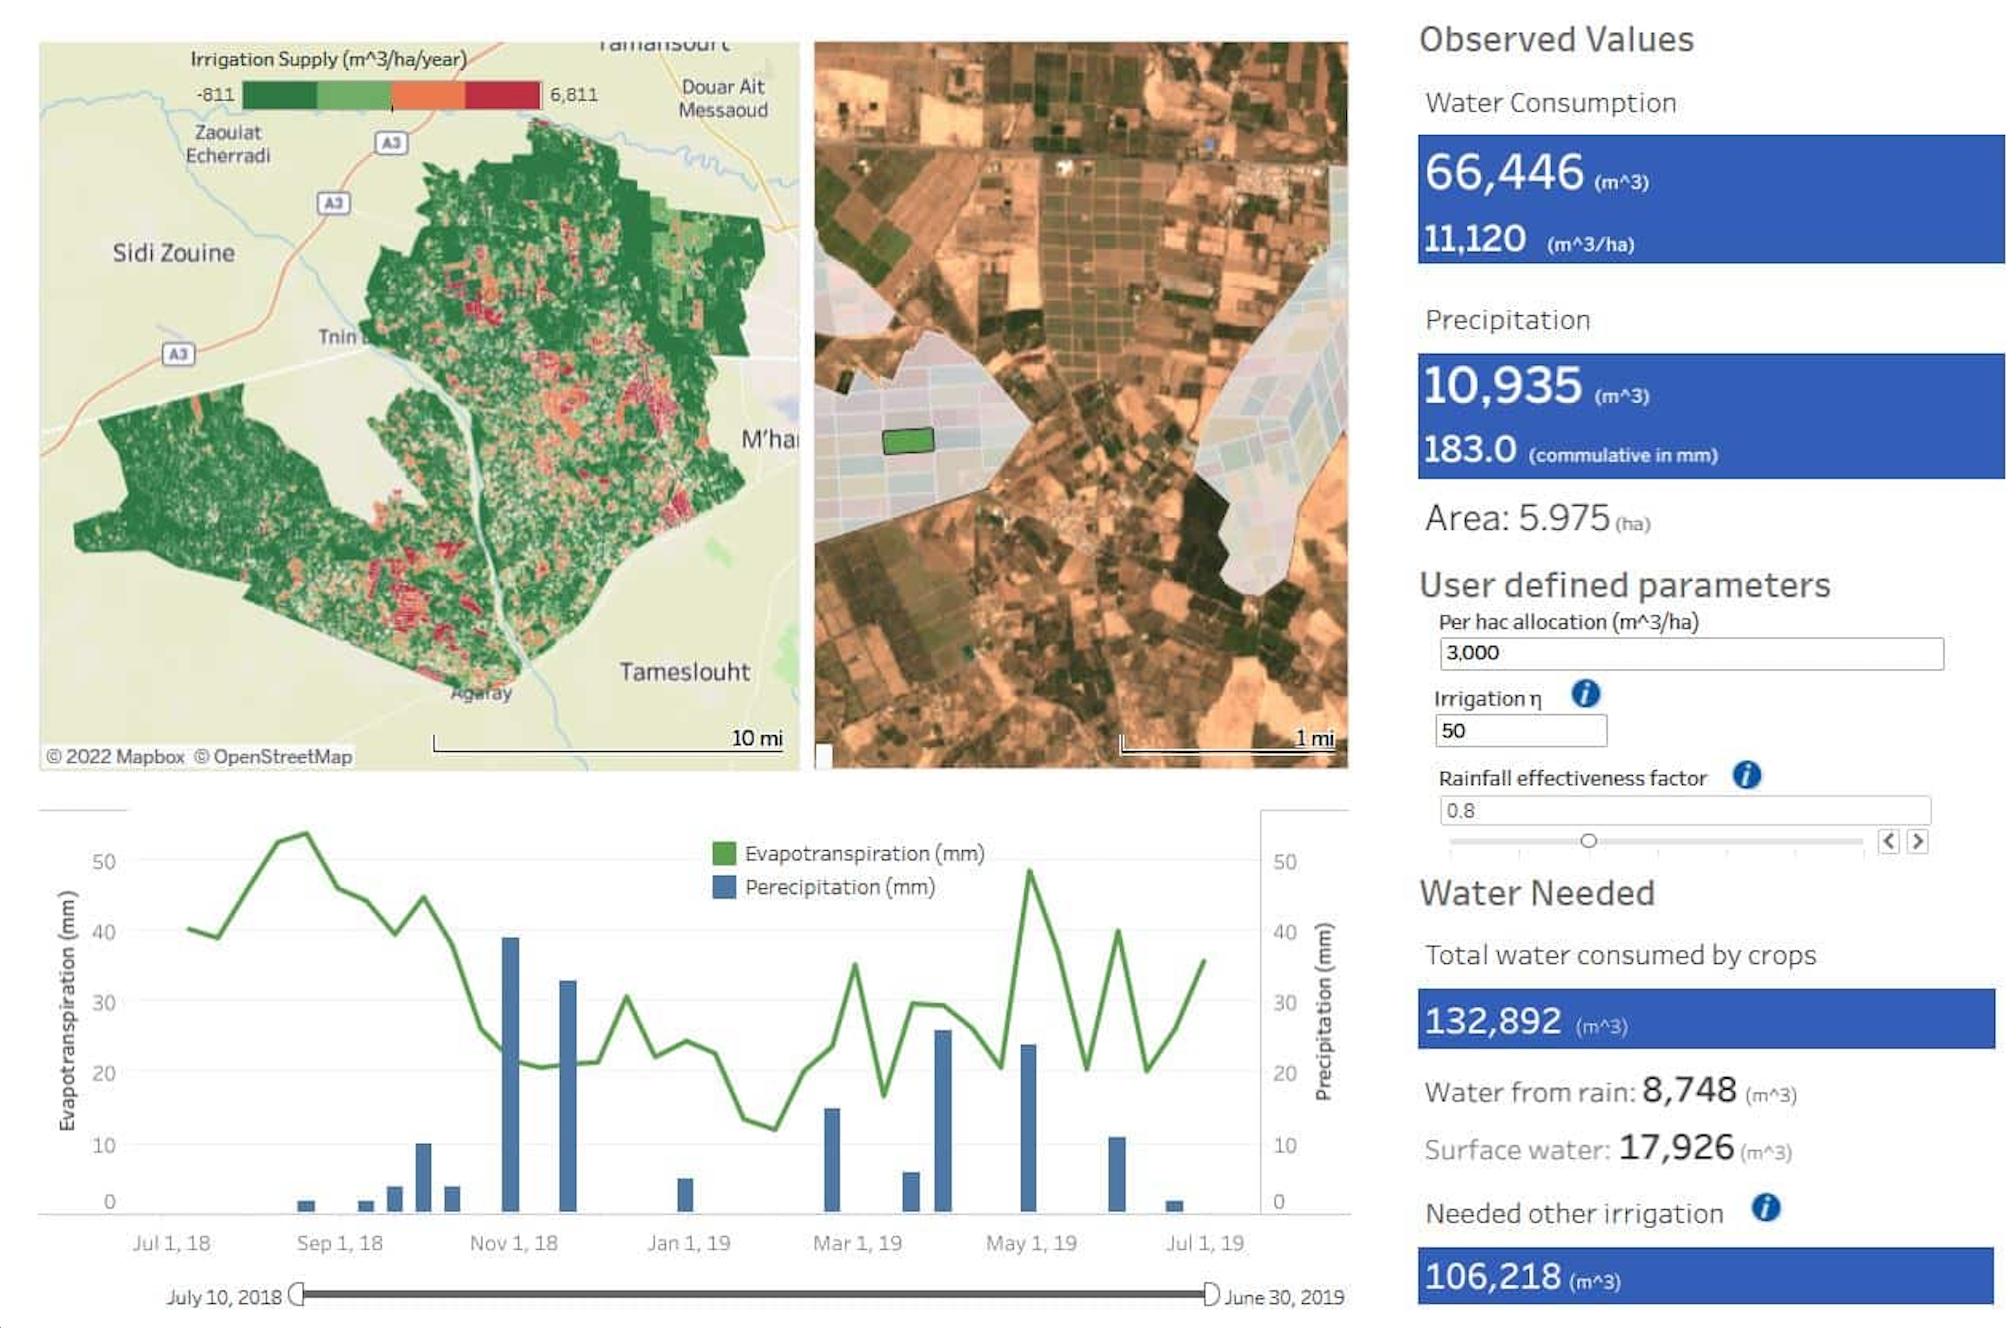
Dashboard available on desktop, tablet and smartphone
1. Select your area of interest from basin, province, commune to field level
2. Explore long-term actual evapotranspiration data at spatial and temporal scales not available in other datasets (2009-present)
3. Import, exchange and export data and figures for communication with partners, authorities and water users
4.Quickly overview consumed water volumes in your selected period and area of interest
Free Service
Resolution: WaPOR data (250m) freely available with time series limitations.
Scale: Bassins, Provinces
Needs: Same as basic version, but limited in time
Subscription for an area of interest.
Basic Service
Resolution: Complete and up-to-date time series of open WaPOR data at a resolution of 100 metres.
Scale: Basins, Provinces, Communes, Aquifers, Perimeters and Irrigated Sectors
Needs:
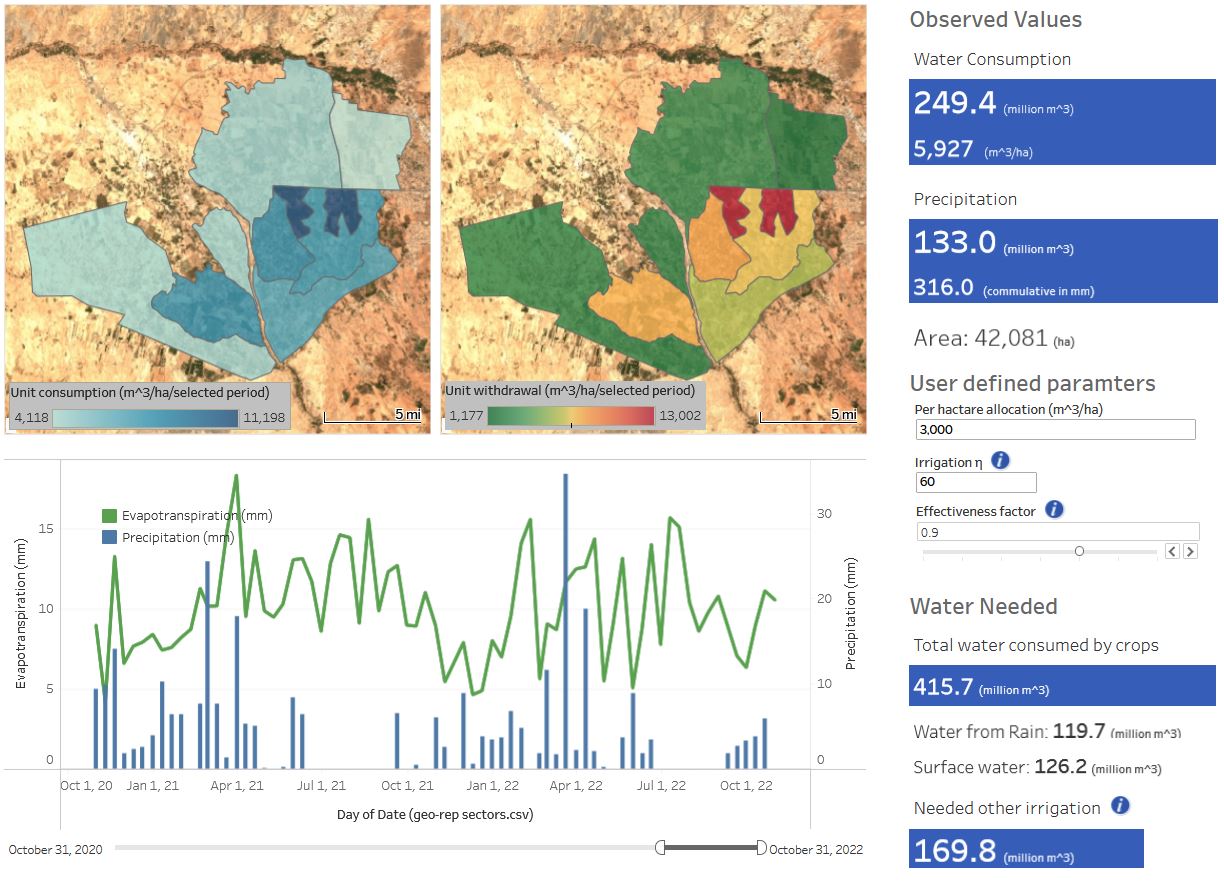
Planned/allocated water versus consumed water
Information on abstractions for the water balance
Water consumption exceeding
Monitoring of boreholes and authorizations
Evolution of irrigated area
Subscription to all historic data from 2009 delivered, yearly fee for the decadal update
Spatial data can be delivered as geodata files for own use in GIS.
High-Resolution Service
Resolution: Updated, commercial 10-meter data at sector and plot level. Scale: Irrigated areas and plots
Needs:
Monitoring of boreholes and permits
Water consumption exceeding
Mapping of irrigation reservoirs
Crop classification and water exceeding
Subscription for an area of 100x100km for a year with decadal update
Spatial data can be delivered as geodata files for own use in GIS.